
Consumption-based emissions for municipal planning
Information
Helsinki Region Environmental Services Authority
9.3.2021
Helsinki Region Environmental Services HSY
PO Box 100, FI-00066 HSY
Phone: +358 9 1561 2110
www.hsy.fi
Photos: HSY / Kai Widell
Examples of consumption-based emissions inventories
In this chapter, three different examples of sub-national or municipal level consumption-based emission inventories are presented. The cases were selected from examples of publicly available inventories conducted or commissioned by municipal or regional authorities to estimate consumption-based emissions within their jurisdiction. Thus, academic studies were excluded at this point. The cases were searched through references in relevant literature, both academic and non-academic, as well as through information disclosed publicly by relevant networks and organisations such as ICLEI or C40. There is a bias in the search towards the northern hemisphere's and European cities, as well as towards information produced in English language.
The total of eleven examples found, summarised in Annex, demonstrate that such inventories are not yet common at city or municipal level, even if the search was not systemic enough to estimate the frequency at which such studies have been conducted. However, existing studies are enough to reveal useful insights into processes related to estimating consumption-based emissions at a local level. It should be noted that a higher number of cities might engage in activities related to reducing consumption-based emissions for example through increasingly common circular economy activities, but the interest here is especially in full emissions inventories conducted.
The cases selected for further analysis in this chapter include the region of King County in the US, as well as Philipstown in the New York State in the US and the Umeå Municipality in Sweden. The case examples were selected so that they represent different approaches to the topic, and more recent analyses were preferred to older ones. Thus, some comprehensive or methodologically sound analyses were left out, even if information from them is being utilised in the discussion section.
The main interests for this study were whether a city or region had included consumption-based emissions in their climate strategy or target setting, the methodology utilised to conduct the emission inventory, and any projects or concrete action taken on the basis of the information.
In addition to municipal and regional level cases from outside Finland presented in this chapter, previous studies related to consumption-based emissions in Finland are briefly discussed in this chapter. These include both academic and non-academic studies.
4.1. King County, Washington, USA
King County is a county in the State of Washington, West Coast of the United States. The capital city of the region is Seattle, and the total estimated population reaches 2,3 million inhabitants (U.S. Census Bureau, 2019). The per capita income was US$ 49,300 which is 50 % higher than the average national income.
King County is one of the few sub-state or sub-national entities that have completed a consumption-based emissions inventory in their jurisdiction more than once. Indeed, it can be said to be somewhat of a pioneer in the topic since the first consumption-based emissions inventory was published already in 2008 – at a time when such inventories hardly existed.
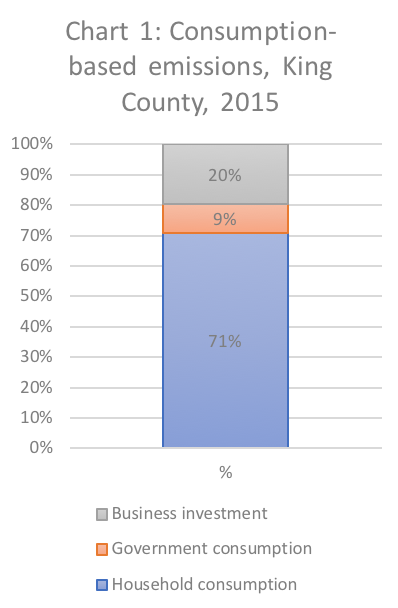
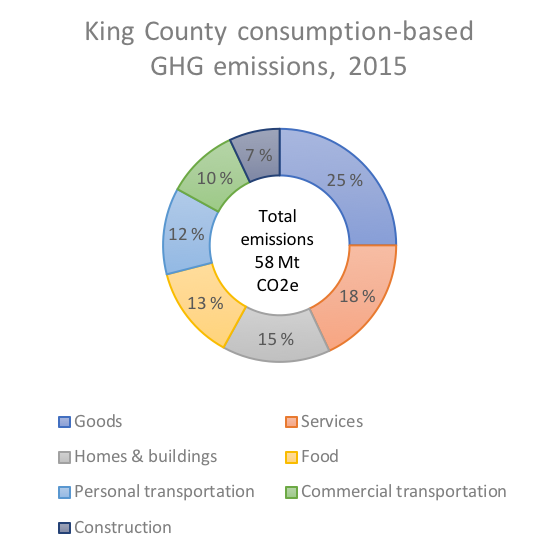
A new consumption-based emissions inventory was published in 2017, containing data from 2015. According to the inventory, the consumption-based emissions in the King County area totalled 58,165 MtCO2e during 2015. Out of that, household consumption comprised 71 %, governmental consumption 9 % and private investment 20 % (Fig. 3). Consumption categories with the highest emissions were goods, services, homes and buildings followed by food and personal transportation (Fig. 4) (Cascadia and Hammerschlag, 2017).
The results from 2015 demonstrate a 5,8 % increase in total consumption-based emissions from 2008, when the previous study was conducted. The per capita spending decreased by 7,8 % during the period, but the report does not mention whether the reduction in spending turned into decreased per capita emissions. Indeed, the report does not present emissions in per capita terms but only in total absolute terms (Cascadia and Hammerschlag, 2017).
The authors of the report utilised the IMPLAN model to obtain data on community demand, as well as imports and exports of 536 categories of commodities. Data for product use and disposal were available through a simultaneously prepared territorial emissions inventory, including information on electricity consumption, vehicle use, heat and hot water, garden and recreation equipment, and landfilling (Cascadia and Hammerschlag, 2017).
One of the shortcomings of the 2015 study is that the emissions intensities related to each sector were not updated in 2015 from the figures utilised in 2008. Thus, any change towards adopting more low-emitting technologies in an industry would not have been be reflected in the results (Cascadia and Hammerschlag, 2017). Overall, obtaining comparative data for two consecutive data sets seem to have proven challenging with the data sources utilised for this study.
Currently, King County is in the process of finalising a new strategic climate action plan that covers emissions mitigation, adaptation and climate preparedness in the region. The draft plan mentions consumption-based emissions, and the means to tackle these include education of citizens, promotion of circular economy, improving recycling and reducing waste, as well as reducing emissions from county procurement strategies. No numeric target for reducing consumption-based emissions have been set, however, the new Strategic Climate Action Plan commits to renewing the consumption-based emissions inventory by 2021. The county has an overall goal to reduce emissions at least 50 % by 2030 and 80 % by 2050, as well as reducing emissions from the County’s government operations by 80 % by 2030 (King County Climate Action Team, 2020).
4.2. Philipstown, New York, USA
Philipstown is a small town with 9,700 habitants in the East Cost of the United States. It is a part of the New York State, as well as Putnam County. The average number of households is 3706 with per capita income of US$ 56,400 in 2018, which is over 50 % higher than the average income in the country (U.S. Census Bureau, 2019).
In 2017, Philipstown joined a state-level initiative, “Climate Smart Communities” program, which includes the creation of a local climate action plan. As part of the initiative, Philipstown conducted a complete community-based GHG inventory including consumption-based emissions that was published in 2020 (Angell and Apicello, 2020). This is a first community level GHG inventory in the New York State that includes both territorial and consumption-based emissions counting. In addition, the inventory document includes a land-use inventory. Philipstown is a member of ICLEI USA, which has significantly supported the inventory together with a local environmental NGO Ecological Citizens Project.
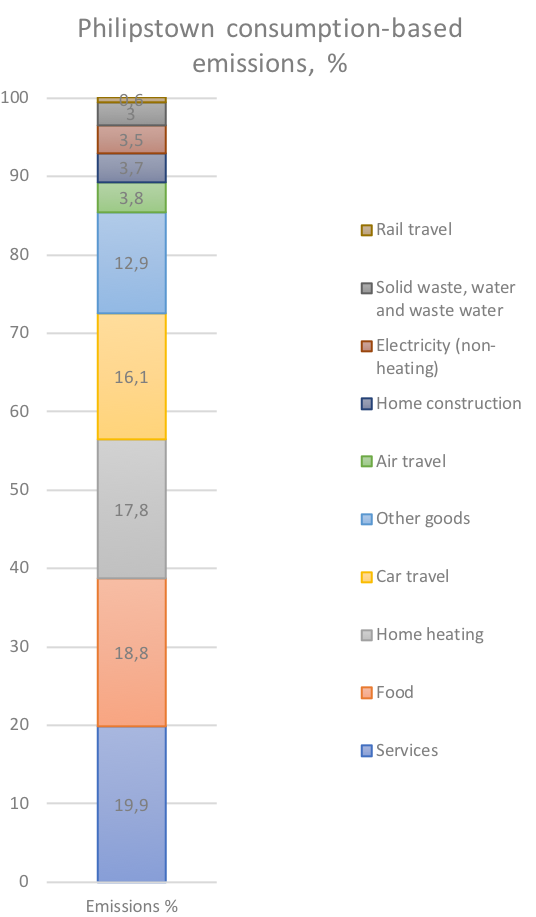
According to the inventory report, the territorial emissions were 11.1 tCO2e/ per capita in 2016, of which 61 % came from transport and 20 % from residential energy. The consumption-based emissions reached 20.4 tCO2e/ per capita in 2019, and services, food, household heating, and travel with private vehicles contributed to most to the emissions (Fig. 5).
The inventory was conducted based on ICLEI USA’s US community protocol (see ICLEI USA, 2019 for the protocol). ICLEI’s ClearPath calculator was utilised to estimate the territorial emissions. To estimate consumption-based emissions, a separate household consumption survey with 261 valid responses was conducted. In addition, consumption of services – including governmental services such as health and education was estimated utilising median income as a proxy for household consumption of services. Part of the food consumption as well as other information were complemented with data from national statistics. The category of other goods and services was estimated based on the data obtained from CoolClimate calculator (Angell and Apicello, 2020). Thus, the final methodology is a hybrid approach including LCA analysis for the main consumption items complemented with data from other sources.
All in all, the Philipstown community-based emissions inventory is an enthusiastic attempt to obtain reasonably accurate emissions data even when availability of data at the local level is limited. While the limitations of the data are openly discussed, such as skewness of data towards higher income and more well-educated respondents, the results are reasonably in line with other similar studies (see Angell and Apicello, 2020). Indeed, the information could be utilised for future policy purposes even if the inventory report is too recent to evaluate its impact on the local policy making and climate target setting.
4.3. Umeå Municipality, North-East Coast, Sweden
Umeå is a city on the northern coast of Sweden, with 129,000 inhabitants in 2020. It belongs to the region of Västerbotten. It has a relatively young and growing population, likely related to the presence of a local university (Umeå kommun, 2020a).
Umeå has set ambitious climate goals, and in 2018 it conducted a consumption-based emissions inventory to better understand emissions from consumption in the city and to guide future policy making.
The city’s new environmental goals published in early 2020 include climate targets for both territorial and consumption-based emissions. The city has the goal to be carbon neutral by 2040, meaning an 85 % of reduction of territorial emissions compared to the year 1990. The aim is to reduce consumption-based emissions from the current 11,5 tCO2e/ per capita to 2 tCO2e/ per capita in 2040 and to 1 tCO2e/ per capita in 2050 (Umeå kommun, 2020b).
The consumption-based emissions inventory indicated that the consumption-based footprint per capita in Umeå in 2018 was 11,5 tCO2e/ per capita including government consumption and private capital formation (Fig. 6) (Axelsson et al., 2018). This is higher than the average of 9 tCO2e/ per capita consumption-based emissions for Sweden in general. However, the results are not entirely comparable since different methodologies were utilised to calculate the footprints for Umeå and for the whole country.
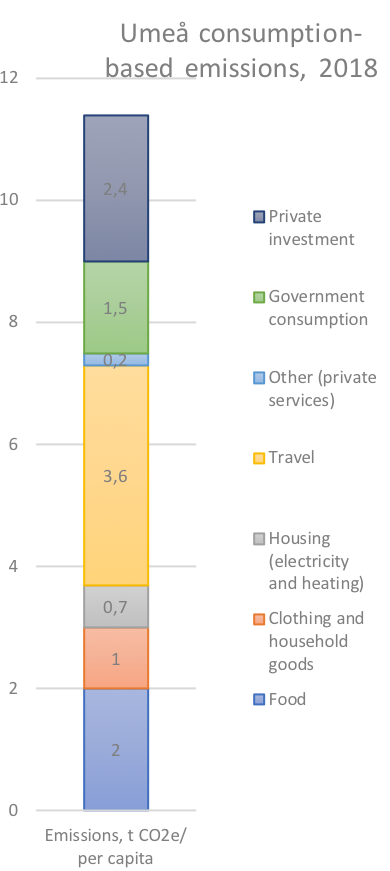
According to the inventory, most of the consumption-based emissions come from travel, which averages up to 3.6 tCO2e per inhabitant (Fig. 6). Out of this, air travel comprises two-thirds, and the rest comes mostly from private car travel. While the emissions from the private car use seem to be in line with the Swedish average, the emissions of air travel of the residents of Umeå are significantly higher than the national average.
Other important emission categories include emissions from food together with government consumption and private investment.
Umeå Municipality utilised a mixed methodology to conduct the consumption-based emissions inventory. First, a local household consumption survey was conducted with an external consulting company with a total of 1475 approved responses. The results from the consumption survey were turned into emissions inventory in a joint project with SEI. SEI utilised both input-output tables and LCA analysis to estimate the emissions: especially items in the food category were estimated through an LCA analysis, whereas input-output tables were utilised for most of the rest of the items. While the consumption survey was conducted in 2018, it was not possible to obtain equally recent data for emissions factors for the consumption categories, and most recent data available has been utilised, that being mostly for 2016, but varying between 2015 and 2017 (Axelsson et al., 2018).
In the consumption survey, older and more educated respondents were overrepresented compared to the distribution of the population in the city. Thus, SEI presented both the actual results, and results weighted by the population to increase accuracy. Umeå Municipality is now using the weighted results in their official communication and statistics. In addition, the consumer survey did not include all consumption categories that are part of traditional consumptions classifications (such as COICOP), and thus for calculating the carbon footprint, categories were added representing the Swedish average. Finally, data about government consumption and private investments were estimated and added separately (Axelsson et al. 2018).
SEI created a model according to which Umeå Municipality can estimate consumption-based emissions also in the future with updated information (Axelsson et al. 2018). SEI also identified hotspots, which could be the first points of attention to start reducing consumption-based emissions. These include flying and car travel, meat consumption, food waste, household energy and consumption of clothing and durable goods. For example, only 18 % of the respondents to the consumption survey affirmed they utilise climate neutral electricity.
Umeå Municipality has integrated consumption-related approach into its climate work. A project “climate neutral place” (Klimatneutrala platsen) as part of a wider “Climate Neutral Umeå 2030” programme integrates activities in various spheres and seeks to promote sustainable life choices amongst the inhabitants in Umeå. The second phase is ongoing from 2020 to 2022. Past activities have included promotion of cycling within the city, initiatives to make restaurants more sustainable, promoting housing co-operatives to support more sustainable life-styles, engaging with schools for sustainable life choices, and integrating the consumption-based perspective into monitoring climate emissions (Umeå kommun, 2019). Citizen engagement is clearly at the heart of the climate work, and Umeå municipality also created a webpage to represent the most central findings of the consumption-based emissions report (Umeå kommun, N.d.).
Overall, Umeå is an example of some of the few cities that have fully integrated consumption-based approach in their climate strategy, including target setting for consumption-based emissions, emissions inventory and follow up, as well as having in place strategies and activities that target emissions reduction from the consumption perspective.
4.4. Consumption-based emissions in Finland
The topic of consumption-based emissions or household carbon footprints has been studied to some extent in Finland, especially in research institutions and academia. While no inventories induced by Finnish municipalities were found, some of the existing research is presented here.
The Finnish Environment Institute (SYKE) has conducted consumption-based emissions calculations for Finnish households in 2002, 2005, 2015 and 2019 utilising ENVIMAT model, that is environmentally extended input-output table specifically constructed for Finland (see Table 1). According to the latest report, the average consumption-based emissions in Finland totalled 73.4 MtCO2e in 2015 (Nissinen and Savolainen, 2019), while the territorial emissions for the same year were 55 MtCO2e (Tilastokeskus, 2019). Thus, the consumption-based emissions were approximately 33 per cent higher compared to the territorial ones. In terms of per capita figures, consumption-based carbon footprint in Finland was 13,400 kgCO2e/ per capita in 2015 (Nissinen and Savolainen, 2019). While Finnish territorial emissions have decreased between 2000-2016, the consumption-based emissions have remained more or less the same, indicating that increase in consumption outweigh the gains in emissions savings elsewhere (ibid., 2019).
Other recently published studies on consumption-based emissions in Finland include the report “1.5 degree lifestyles” associated with Sitra’s (The Finnish Innovation Fund) work on sustainable lifestyles. According to this report by IGES et al. (2019), the current consumption-based carbon footprint of Finnish households reaches approximately 10,400 kgCO2e/ per capita, of which a reduction down to 700-1,000 kgCO2e/ per capita by 2050 would be required to maintain the consumption-based emissions in line with the targets to maintain the global temperature within the limit of 1.5 degrees (IGES et al. 2019).
Ottelin et al. (2018b) compare consumption-based carbon footprints and material footprints of different income groups in Finland. The per capita footprint, including government services and consumption, totalled 12,310 kgCO2e in Finland based on 2012 consumption data. Their main findings include the notion that income transfers related to public welfare services balance to some extent carbon footprints of households in different income groups. Even so, the household carbon footprint tends to correlate highly with available income.
Research conducted on consumption-based emissions at a local level, including the Helsinki metropolitan area, dates back 10-15 years. A comparative research study between cities reveals that consumption-based emissions based on data from 2006 were 11,100 kgCO2e/ per capita in Vantaa, 12,400 kgCO2e/ per capita in Helsinki and 14,400 kgCO2e/ per capita in Espoo (Heinonen and Junnila, 2011a). The study compares carbon-based footprints in the Helsinki metropolitan area and the Tampere metropolitan region, concluding that income is heavily correlated with the carbon footprint of city residents, as opposed to for example population density. The highest share of the carbon footprint comes from electricity and heating, followed by other housing related emissions and private transport. Another comparative study between the consumption-based emissions in Helsinki and Porvoo revealed interesting differences: while the overall footprint of Porvoo was lower than that of Helsinki, mainly due to lower emission intensity of district heating, the emissions from private transport were significantly lower in Helsinki (Heinonen and Junnila, 2011b). Understanding the city-specific carbon footprint may help to tailor effective city-specific policies to tackle consumption-based emissions.
Some studies analyse footprints of different consumer groups, such as “high-rise” and “low-rise” living (Ala-Mantila et al., 2013), or urban zones (Ottelin et al., 2018a) within the Helsinki metropolitan area. These studies indicate that residents living in detached housing in outskirts of Helsinki metropolitan area tend to have a higher carbon footprint than those that live in the urban zones with good public transport connections. On the other hand, the highest carbon footprints are found in the city centre (of Helsinki), correlated with the highest available income.